The Best Way To Predict Heart Attack Risk

Many traditional ways of measuring your risk for having a heart attack are not nearly as accurate as many believe. For example, many believe that our total cholesterol and LDL are the best indicators for heart disease, but the association is weak. As far back as 1964, Garrett, Horning, and Creech found no definite correlation between serum cholesterol levels and the nature and extent of atherosclerotic disease. They published their findings in the Journal of the American Medical Association. 1 The famous Framingham heart study concluded in 1977 that HDL was a much better predictor of heart disease than LDL, and total cholesterol was not associated with any risk. 2 In 1997, The Lancet published a paper on the elderly that showed for each 18 mg/dl increase of cholesterol, the chance of death went down by 15%. Amazingly, they also found that mortality from cancer and infection was significantly lower among the participants in the highest total cholesterol category. 3 Uffe Ravenskov and others, in 2016, analyzed all studies of LDL levels available on Pubmed and found in all but two that LDL protected against cardiovascular disease. The two that did not show that high LDL was protective showed no correlation. 4 Finally, a 2009 study involving almost 14,000 subjects revealed that nearly 75% of hospitalized patients for a heart attack have LDL cholesterol levels within the recommended. 5 I will get to the best test for heart attack risk later, the CAC test, but I need to give a little background first. If I lose you, just skip to the part about the CAC test near the end of this post.
Lies, Damn Lies, and Statistics

Many believe LDL and total cholesterol to be good predictors of heart attacks because they don't understand the weak statistical relevance behind them. So, without getting into a whole course on statistics, let me talk a little about odds ratios, risk ratios, and p-values. Odds Ratio is a measure of the strength of association with exposure and an outcome. Risk ratios are similar but are usually a bit lower. An odds ratio of 1 means that there is no effect. Greater than one means there is, and less than one means that there is a reverse correlation. Either way, an odds ratio of 1.1 is weak, and one of 3 is very strong.
In most instances, the risk ratio of total cholesterol is about 1, meaning no correlation between total cholesterol and heart disease. For LDL, the risk ratio is below 1; it protects against cardiovascular disease, and indeed, all-cause mortality. 6
Another valuable number to understand is the P-value. The null hypothesis assumes that your theory is 100% wrong, and there will be no difference between the experimental and control groups. The p-value represents how far from random your hypothesis is: the lower it is, the less chance your results are random. Thus, a p-value of 1 ( a 1:1 ratio) means no difference between the groups; the results were equal, the ratios were identical, giving a p-value of 1. Put another way, the lower the p-value, the greater the null hypothesis's odds are untrue. Generally, a value of .05 is standard.
Triglyceride, HDL, and the Triglyceride: HDL Ratio Are Better Than Total Cholesterol and LDL

In 2008, researchers concluded that triglyceride, HDL, and the ratio between them were statistically significant. For triglycerides, the odds ratio was 2.02, which means that patients with high triglycerides have twice the probability of having a heart attack than those with normal levels. The p-value was 0.0018, meaning that their findings were far from random. For HDL, the odds ratio was similar at 2.21, and the p-value was a solid 0.0005. Finally, they found that the triglyceride: HDL ratio to be 2.01 with a p-value of 0.0018. Researchers have also found that a poor triglyceride: HDL ratio is highly associated with insulin resistance and diabetes, and I will address this later. 7
Not surprisingly, total cholesterol came in with an odds ratio of 1.25 and a p-value of 0.33 and LDL had an odds ratio of 1.47 with a p-value of 0.0842. Although higher than 1, the odds ratios are coupled with poor p-values, indicating too much randomness to assume much, if any, correlation. Thus, the researchers concluded that the findings for total cholesterol and LDL were not statistically significant. I am not telling you to never get these tests, they are still a good way to see your overall metabolic and cardiac risk profile.
Insulin Resistance and Fasting Insulin

As I mentioned before in this post, and written about before here, a high triglyceride to HDL ratio is also associated with diabetes and insulin resistance. Insulin resistance is commonly associated with increased insulin when fasting, and diabetes is a common outcome of both. Heart disease is associated with diabetes, and studies find it is an independent predictor for significant adverse cardiovascular outcomes. 8 Since high fasting insulin is an independent risk factor from diabetes, it makes sense that researchers have connected high fasting insulin, even in non-diabetics, to heart disease. 9 In patients without diabetes, elevated fasting insulin levels was also a good predictor of fatty livers, which I will discuss next.10
Non-Alcoholic Fatty Liver Disease

Non-alcoholic fatty liver disease, or NAFLD, is becoming increasingly common. It is usually associated with obesity, but it is often found in thin patients too. 11 A Swedish study found that over 10% of subjects had NAFLD, despite being thin and having few markers for heart disease and diabetes. NAFLD is a mirror of metabolic syndrome because they share several characteristics. Recent data suggest that NAFLD is linked to increased cardiovascular risk independently of metabolic syndrome risk factors. 12 The problem is that most doctors won't order a liver scan. Fortunately, there is a very strong incidence of coronary artery calcification seen with NAFLD. 13
Coronary Artery Calcification or CAC: The Single Best Test For Heart Attack Risk
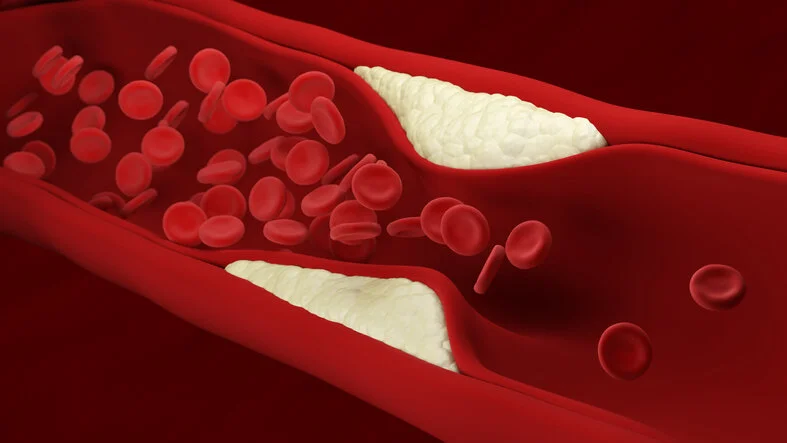
In heart disease, the heart's arteries fill with plaque, which is typically 30% calcified. A quick CAT scan, called a coronary calcium scan, can easily show if you have calcifications, and it typically costs less than $125 out of pocket. However, since fasting insulin and checking for NAFLD are not part of routine physicals, early detection of potential heart disease is missed, especially in thin patients. Interestingly, risk increases are more prominent in people with few metabolic risk factors, so screening for CAC is a good strategy. The test results range from zero to over 4000 and break down into five categories:
Zero, no plaque, and your risk for a heart attack is low.
1-10, a small amount of plaque, and your risk for a heart attack is less than 10 percent.
11-100, you have mild heart disease, and your risk for a heart attack is moderate.
101-400, you have heart disease, and plaque may be blocking an artery. Your chance of having a heart attack is moderate to high.
Over 400, you have more than a 90 percent chance of plaque blocking one of your arteries. As a result, your chance of heart attack is high.
The three-dimensional graph below shows how significant your CAC score is compared to many other risk factors discussed today. Along the front are the number of possible risk factors ranging from zero to over three. The risk factors the researchers considered were current cigarette smoking, poor blood lipids (cholesterol, triglycerides, LDL, HDL), diabetes, high blood pressure, and a family history of coronary heart disease. From front to back are four CAC scores; 0 (yellow), 1-100 (green), 101-400 (blue), and over 400 (red). The scale on the left represents the number of heart attack deaths per 1000. As you can see, as the number of risk factors increases from left to right, the risk of dying of a heart attack increases, as expected. But notice as the CAC score increases from front to back, there is a much more dramatic increase in the death rate. The red columns stand very tall, even for people with no risk factors.
Mortality rate per 1000 with increasing coronary artery calcium (CAC) scores according to burden of risk factors (RFs).

https://www.ahajournals.org/doi/full/10.1161/circimaging.111.964528
This graph should convince you that the best test for predicting whether you may die of a heart attack is the CAC test. I have done two so far and have gotten a big fat zero, so my heart attack odds are low. The chart below shows an alternate way to categorize your score by estimated arterial age based on your score.
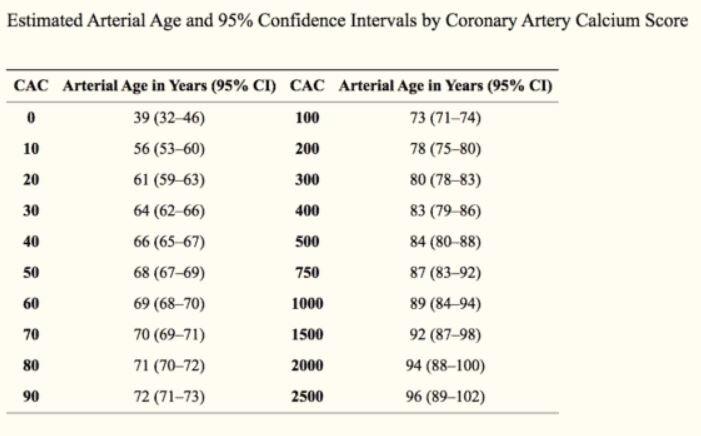
https://www.ncbi.nlm.nih.gov/pmc/articles/PMC2621006/
I may cover what you should do if you have calcifications in another post. Since you need a prescription from a physician to get a coronary calcium scan, they can advise you of how you can mitigate your chances of having a heart attack. As always, this post is should not be a substitute for medical advice from your doctor, and it is not meant to diagnose or treat any medical problems. However, lowering your fasting insulin, finding out if you have a fatty liver, getting rid of it, and reducing your triglycerides are all critical. Less important is reducing your total cholesterol and LDL.
The best way to do all of the things I just mentioned is to eat a whole foods diet devoid of processed carbohydrates and seed oils. I have written about how to do this here and here. Other recommendations include good sleep, stress reduction, and exercise. I would recommend starting today whether you have heart disease or not. Your life depends on it.